Visualise data from your device
In this section, we will explain to you how to create widgets for data visualisation and set up your device's dashboard on Pybytes.
We assume that you already have your device connected to Pybytes. In case you haven't, check how to add your device here. After your done with that, you can proceed to the next example.
Step 1: Set up your python application
The first step is to have your python application uploaded and running on your Pycom device.
Install the Pymakr plugin.
(We highly recommend using Pymakr with Atom, but you can also use Pymakr with VS Code). Learn more about Pymakr here.
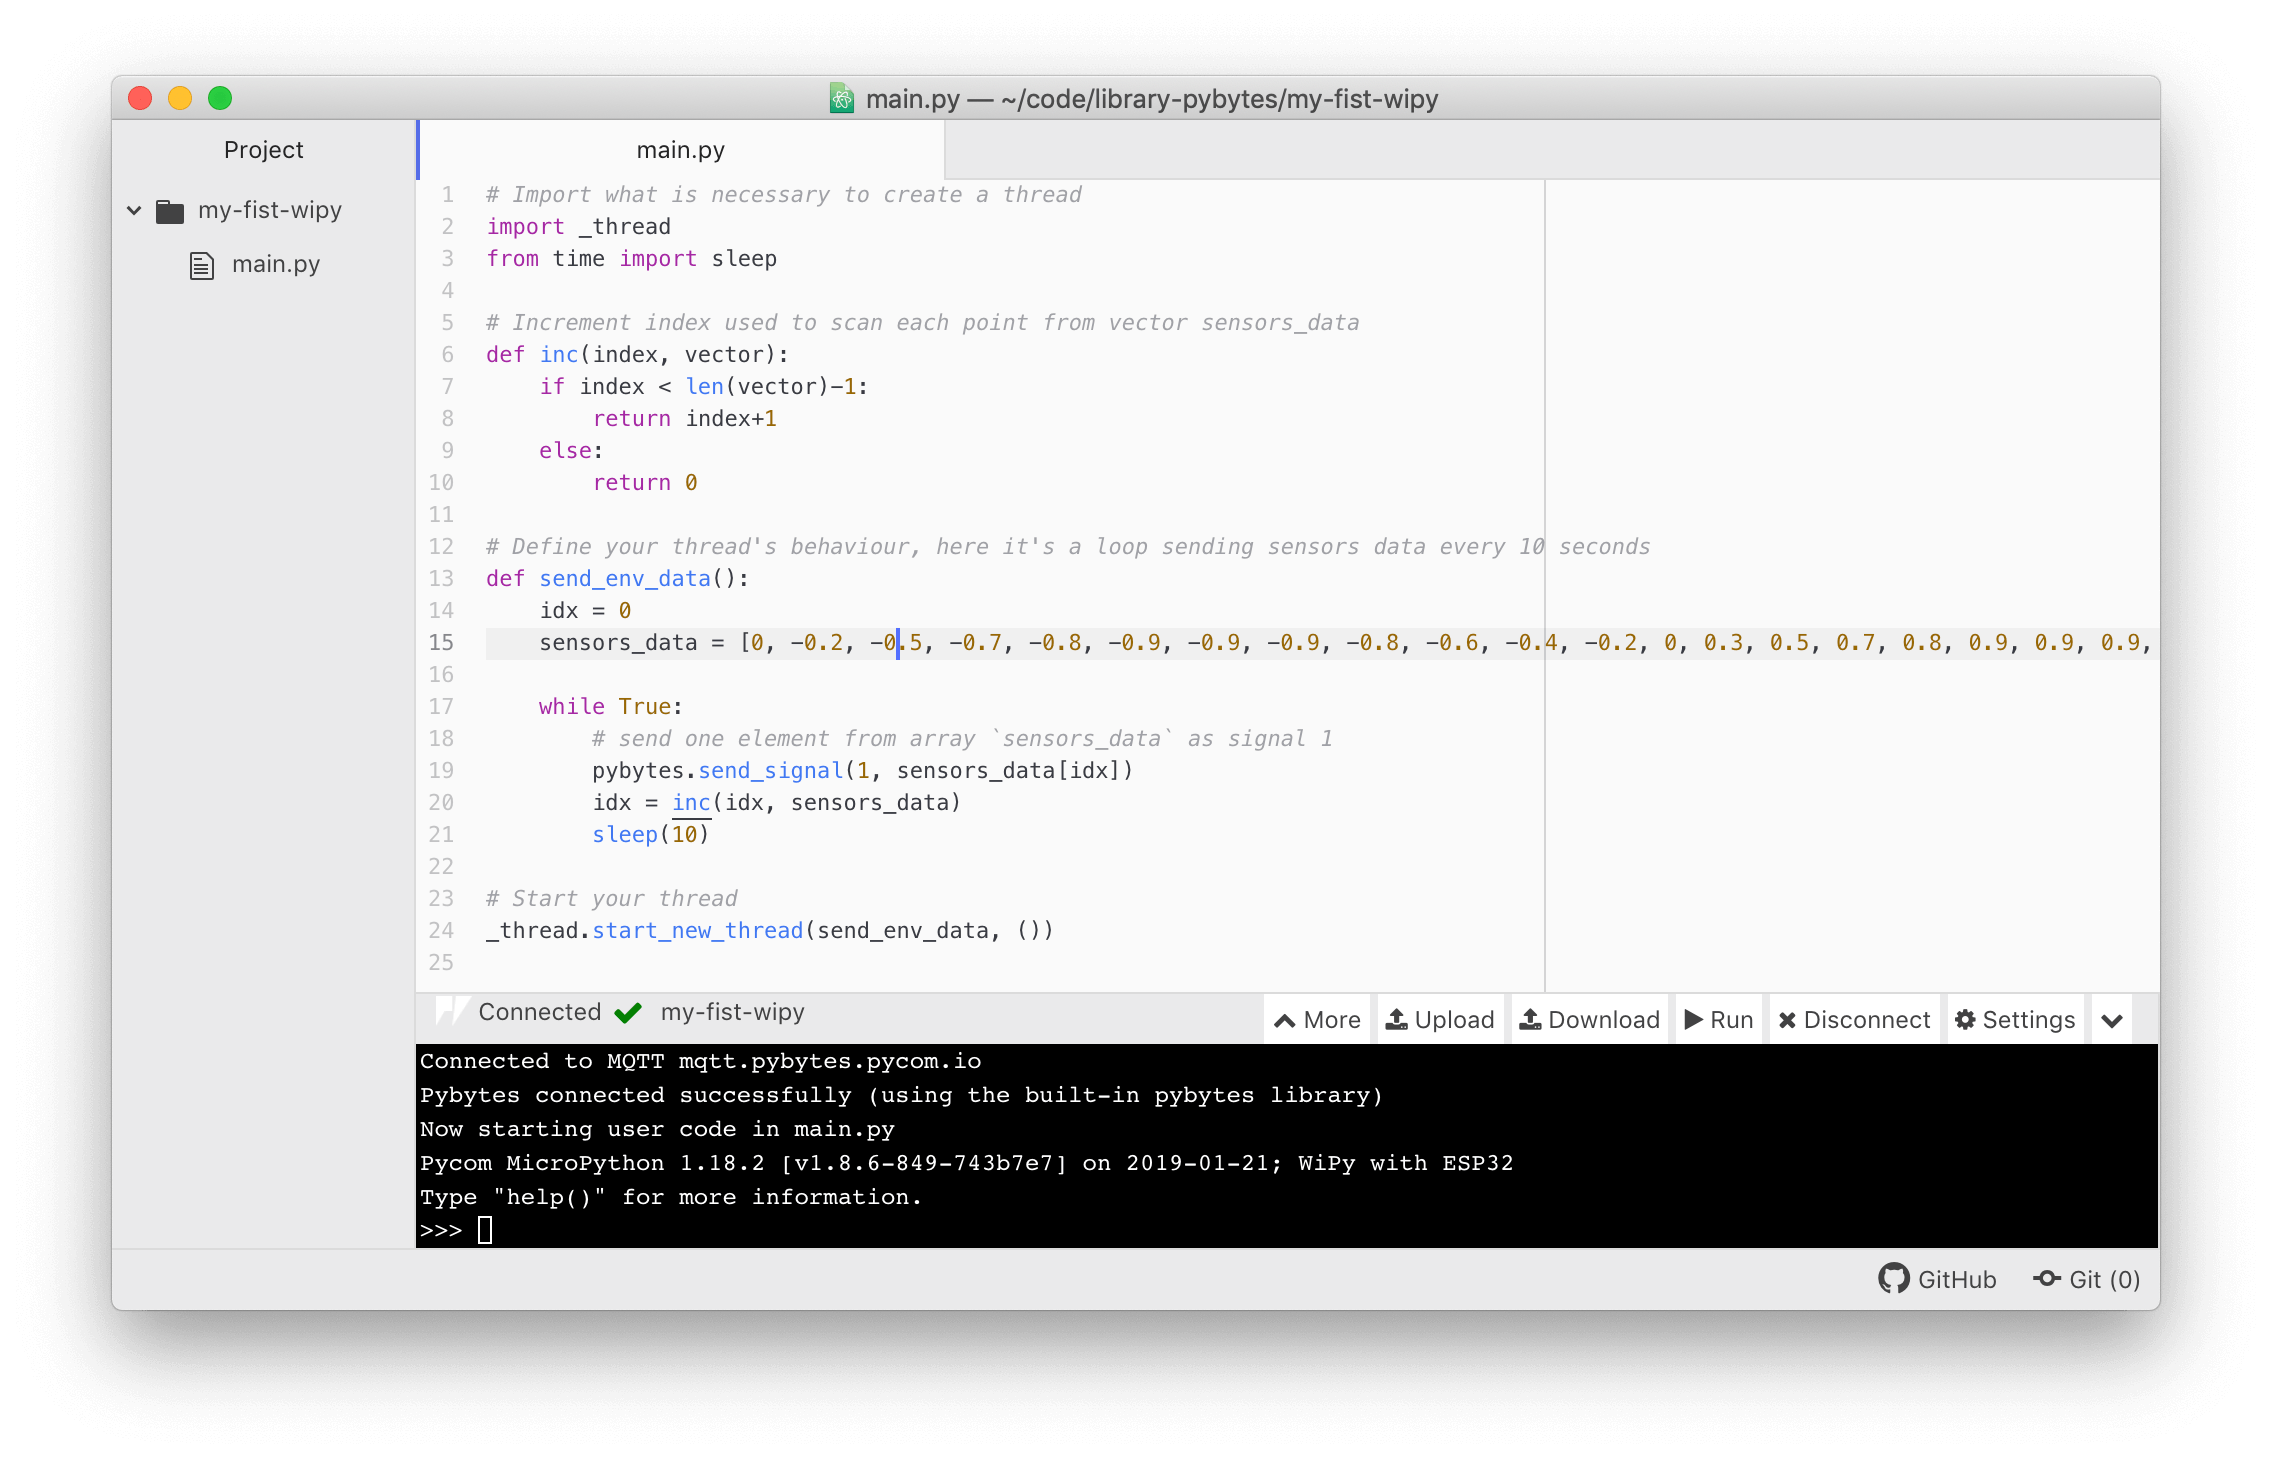
- In Atom create a project folder
my-first-wipy(any other name will work as well). - In your project folder create the
main.pyfile - Copy and paste the following code into your
main.py
Scroll a bit down to see the picture of the project structure in Atom.
This python application will send data from the array every 5 seconds to Pybytes.
# Import what is necessary to create a thread
import _thread
from time import sleep

# Increment index used to scan each point from vector sensors_data
def inc(index, vector):
    if index < len(vector)-1:
        return index+1
    else:
        return 0

# Define your thread's behaviour, here it's a loop sending sensors data every 5 seconds
def send_env_data():
    idx = 0
    sensors_data = [0, -0.2, -0.5, -0.7, -0.8, -0.9, -0.9, -0.9, -0.8, -0.6, -0.4, -0.2, 0, 0.3, 0.5, 0.7, 0.8, 0.9, 0.9, 0.9, 0.8, 0.6, 0.4, 0.1]

    while True:
        # send one element from array `sensors_data` as signal 1
        pybytes.send_signal(1, sensors_data[idx])
        idx = inc(idx, sensors_data)
        sleep(5)

# Start your thread
_thread.start_new_thread(send_env_data, ())
In this code, we're calling the function pybytes.send_signal(signalNumber, value)) to send data to Pybytes. This function is part of the Pybytes library, and it has two arguments: signalNumber and value.
signalNumberrepresents which signal is receiving data:255 different values: 0 ... 254 (signalNumber 255 is reserved for the Pybytes terminal)
valueis the value being attributed to that particular signal number
Your example project in Atom (with Pymakr) should look like this. Press Upload button to upload the code into your device.
By default, Pymakr will upload all files like *.py from your project folder (my-first-wipy in this case).
File main.py will be uploaded to /flash folder on your device.
After the upload is done, the device will reboot and start sending data to Pybytes. In the Pymakr terminal, you should see messages send to Pybytes.
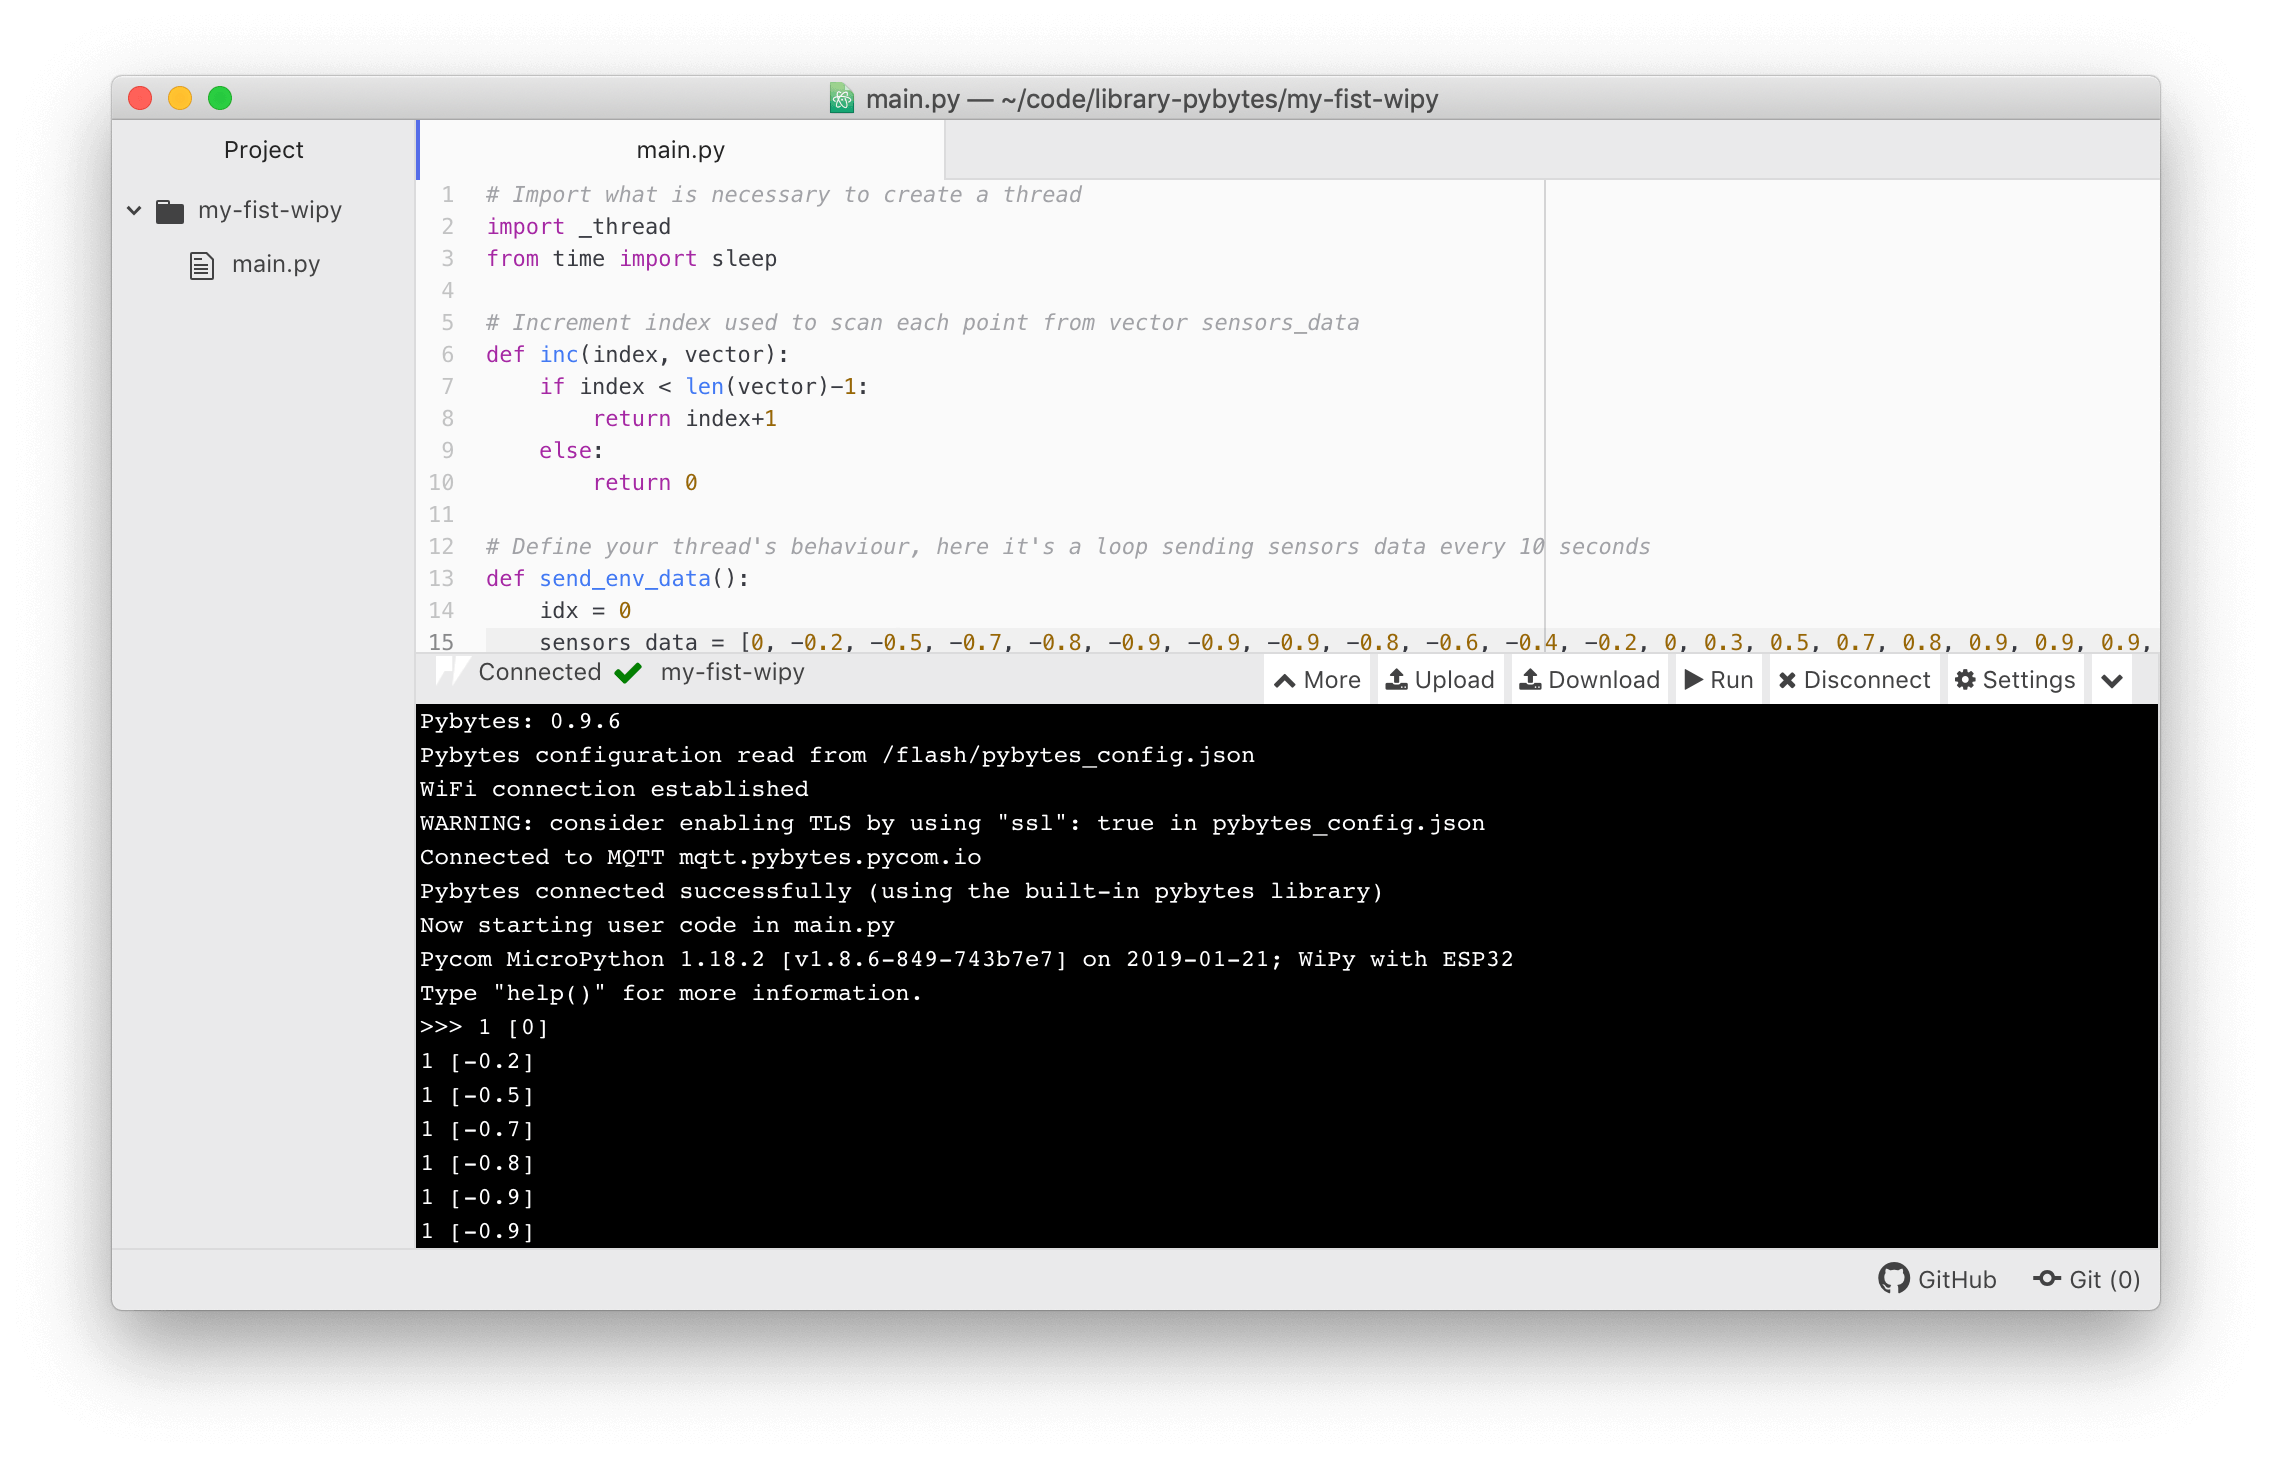
Every line stands for one message sent every 5 seconds. Line 1 [-0.7] means signal 1 sent value -0.7.
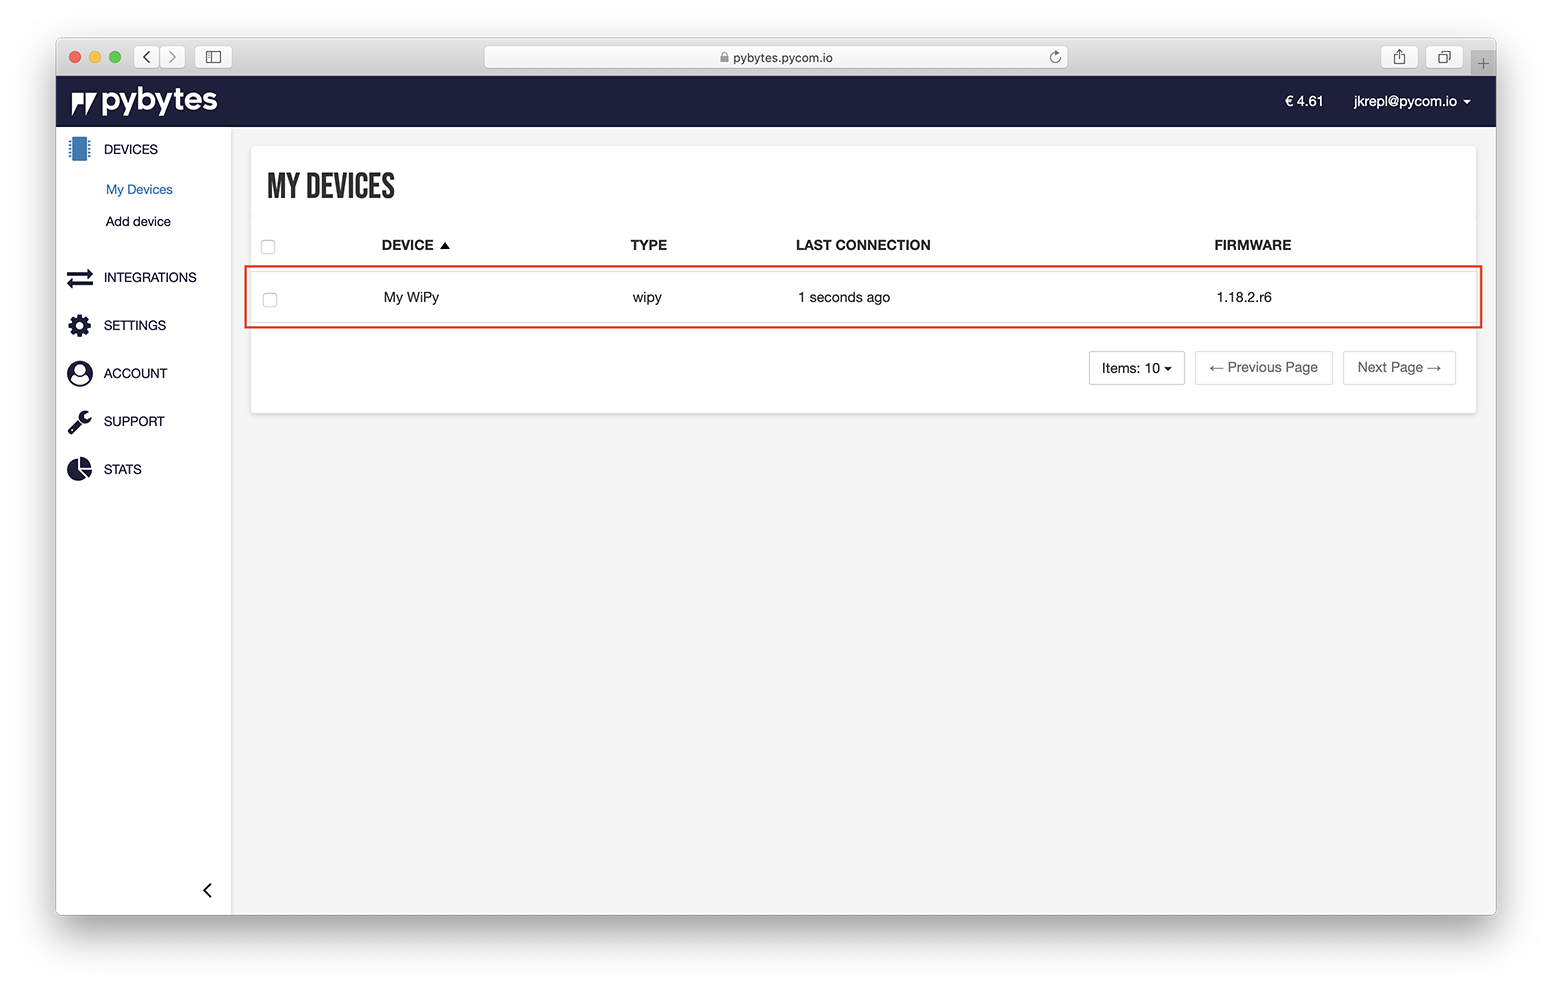
Step 2: Add a signal from your device
Go to Pybytes and on Devices page select your device;
Then go to Data tab and click on the row in the Undefined signals table (recommended). Alternatively, you can click on Define new signal button.
If you don't see your undefined signal in Undefined signals table, please reload your browser.
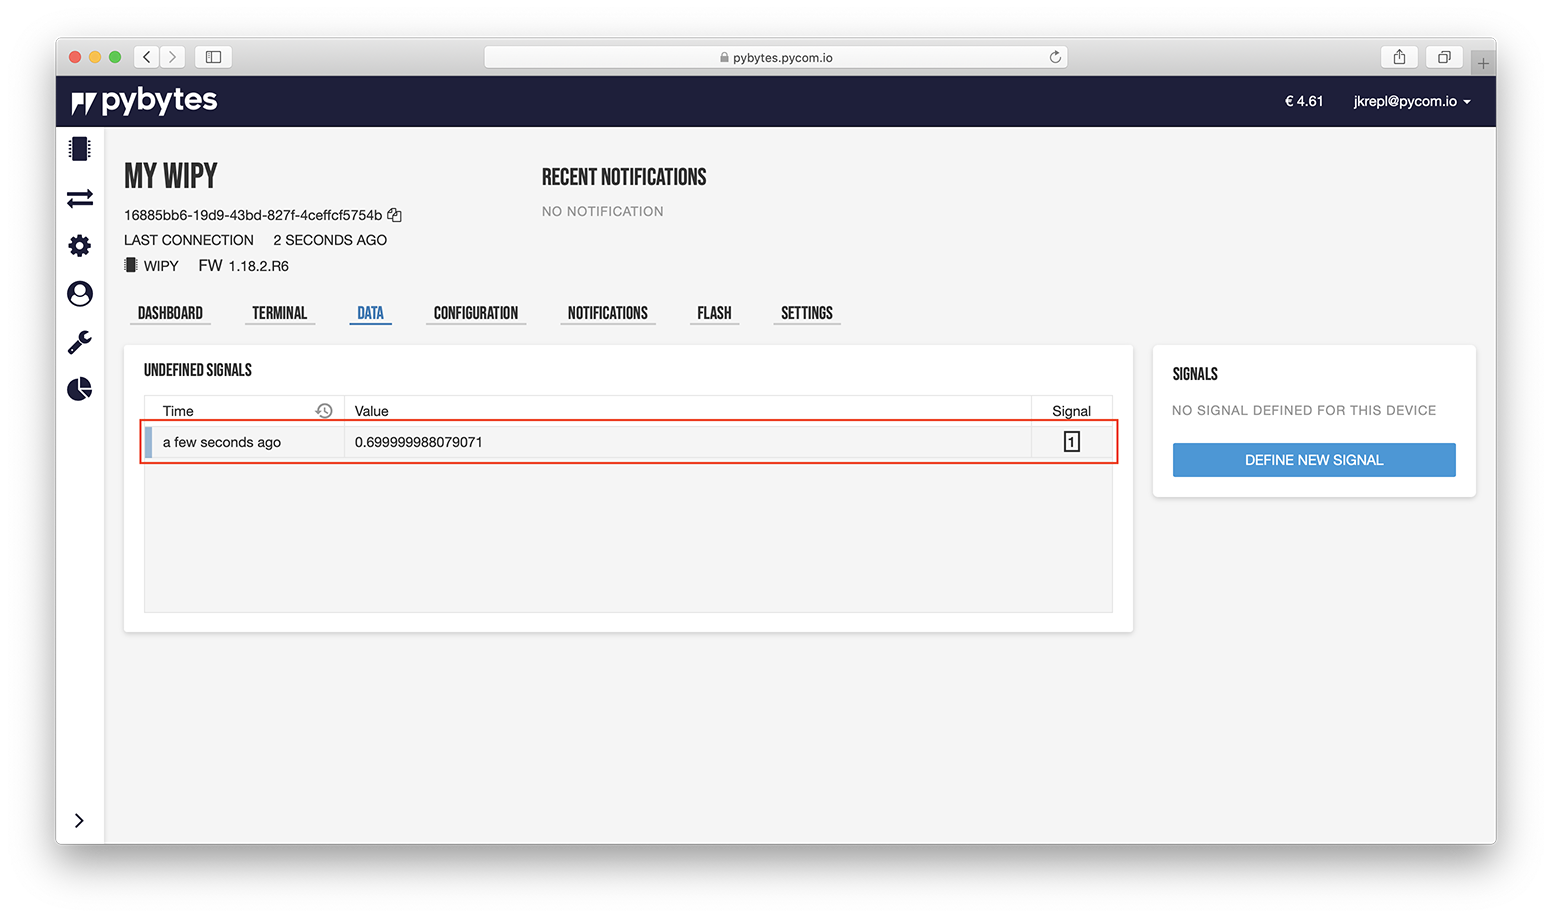
Define new signal by entering a signal name, and optionally a unit (If you clicked on "undefined signal row" your signal number 1 will be already pre-filled).
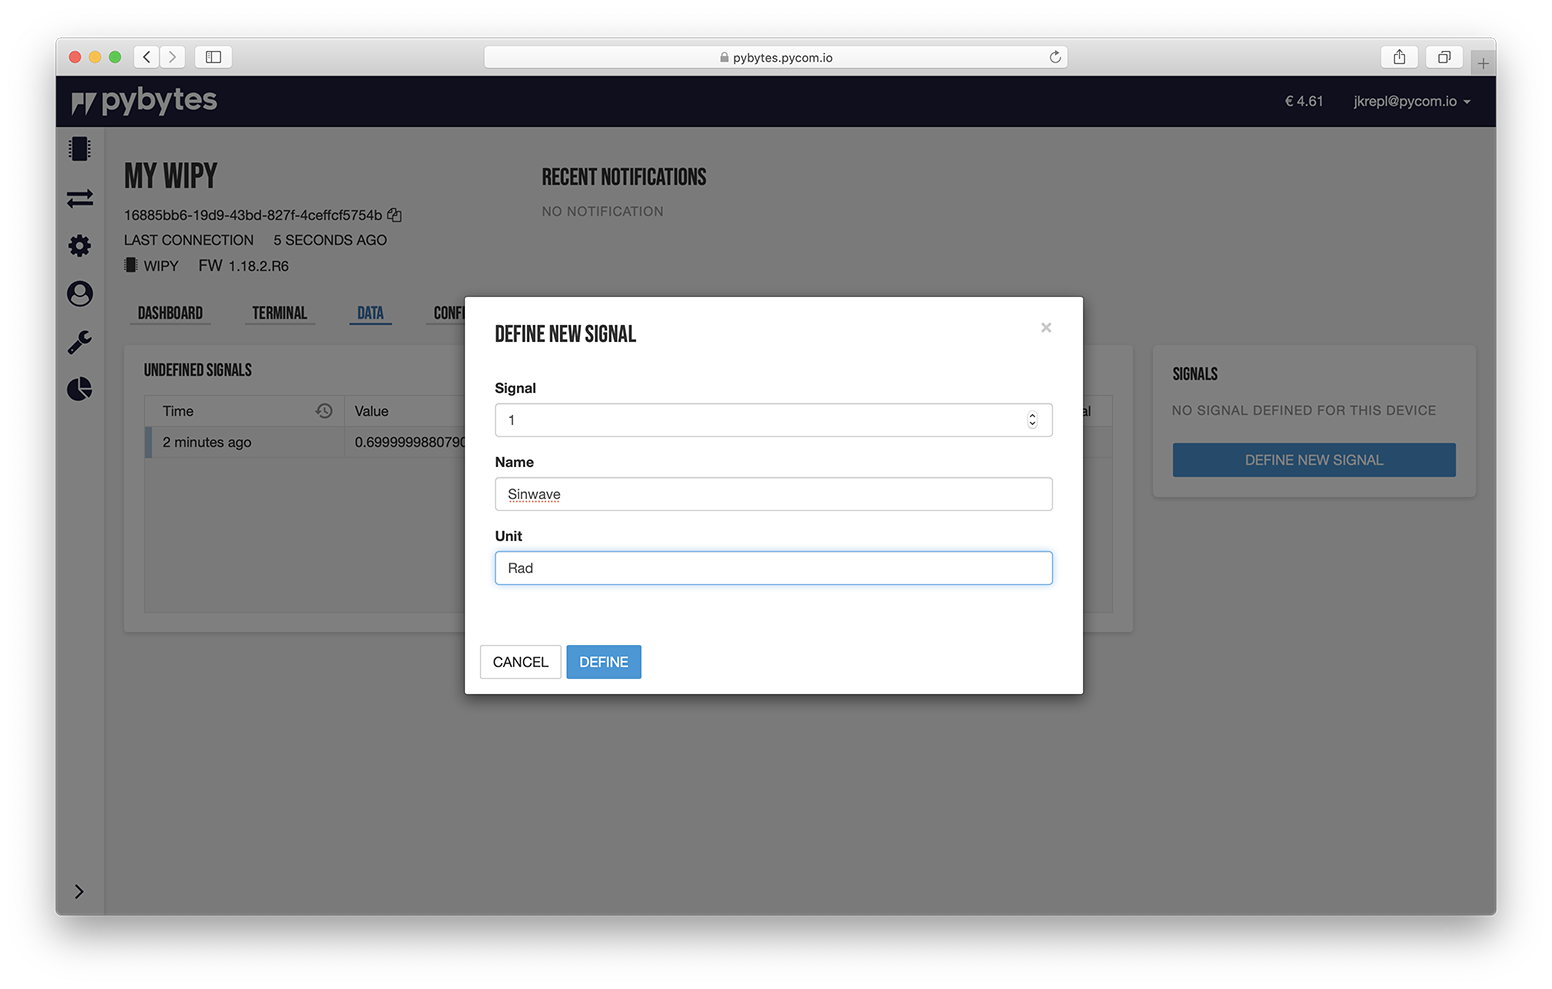
Your signal was defined!
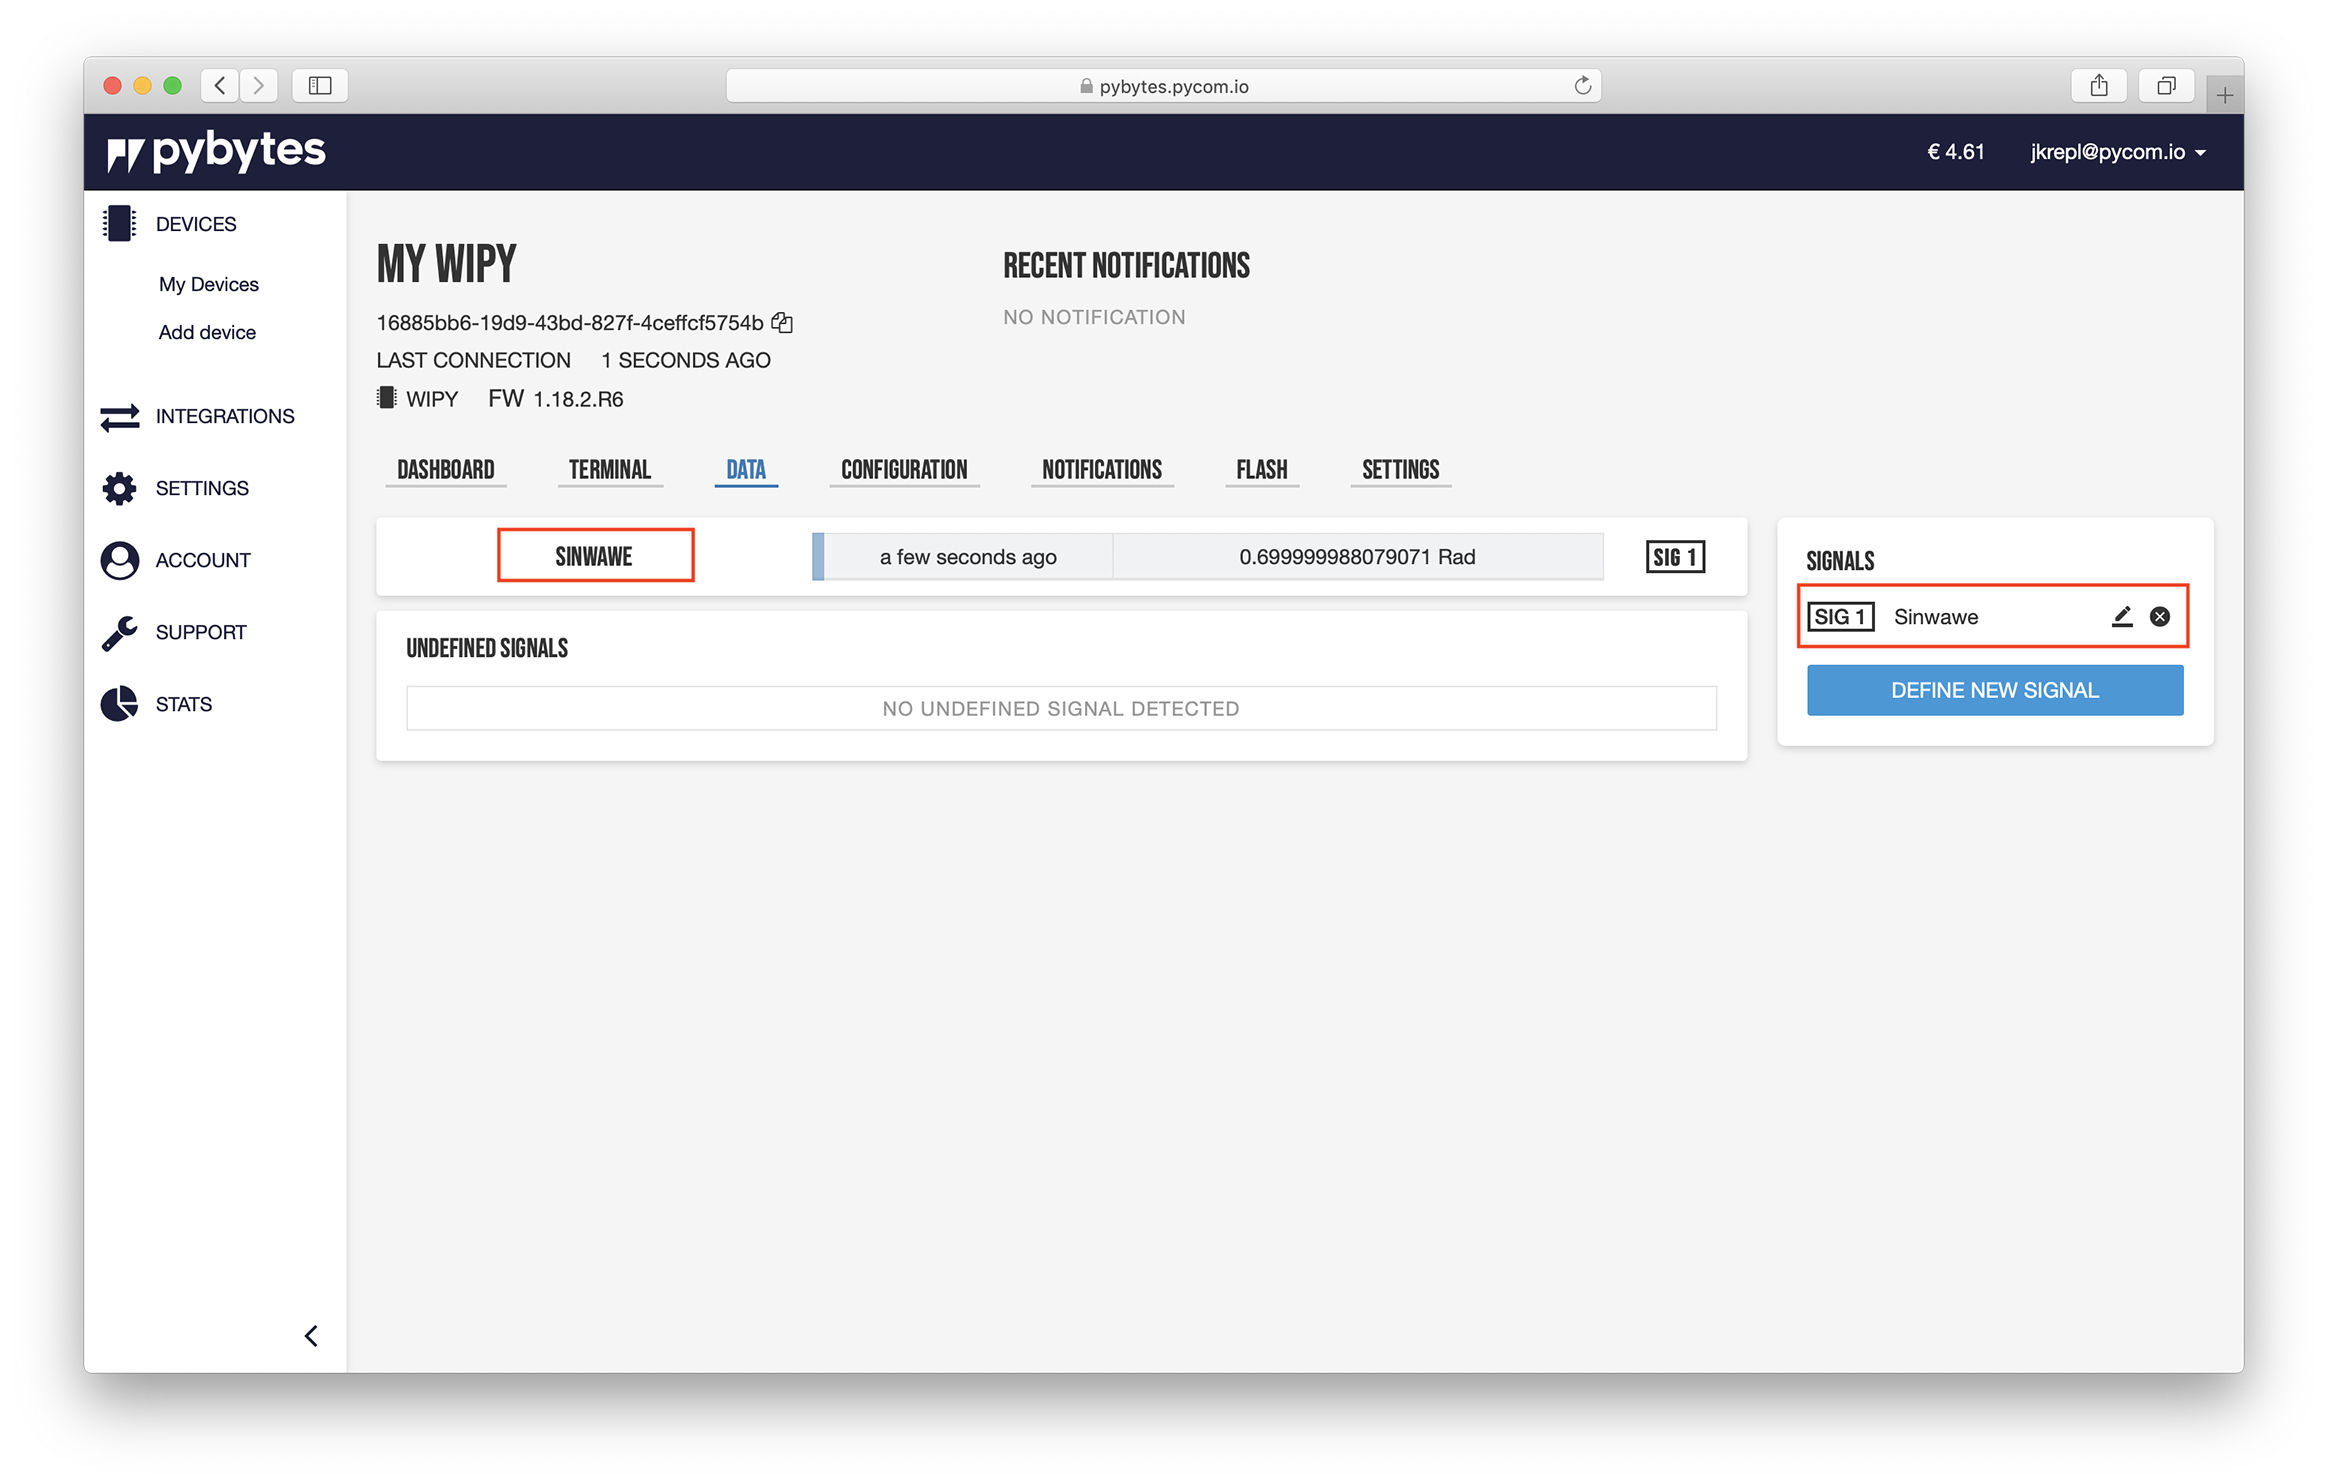
The name and unit are labels used to identify your signal inside Pybytes (In this example we defined Sinwave as the name of the signal and Rad as the unit).
The signal number has to match the signal number that you defined on pybytes.send_signal function call, inside your main.py code (In this example we defined signalNumber = 1);
Step 3: Add a widget for the signal
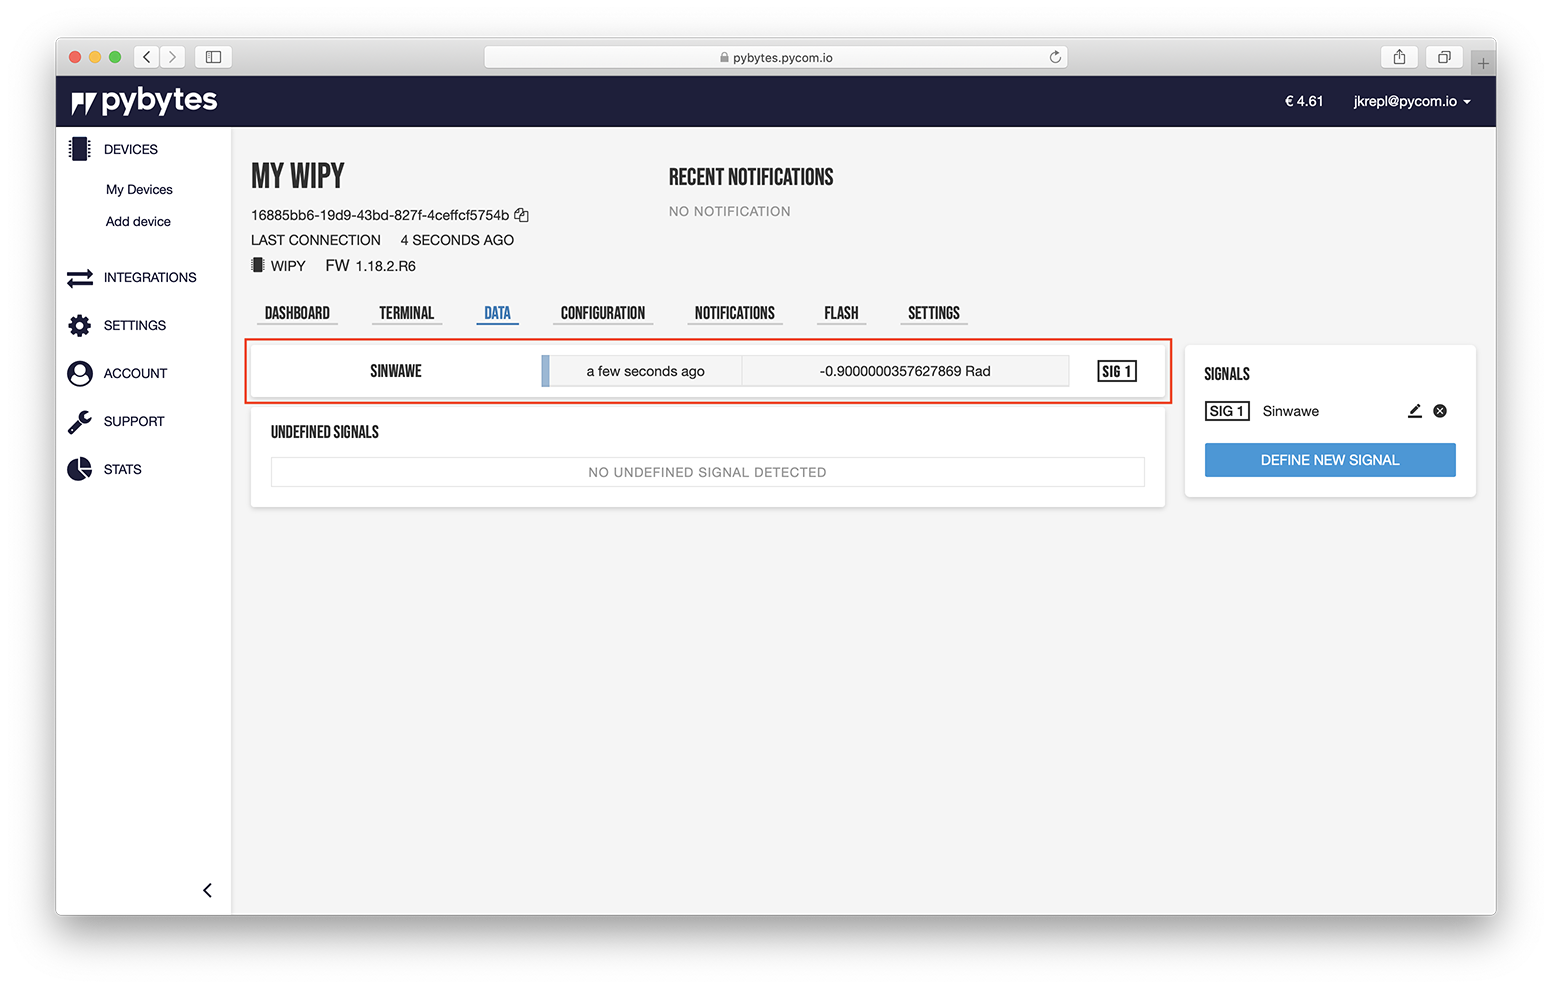
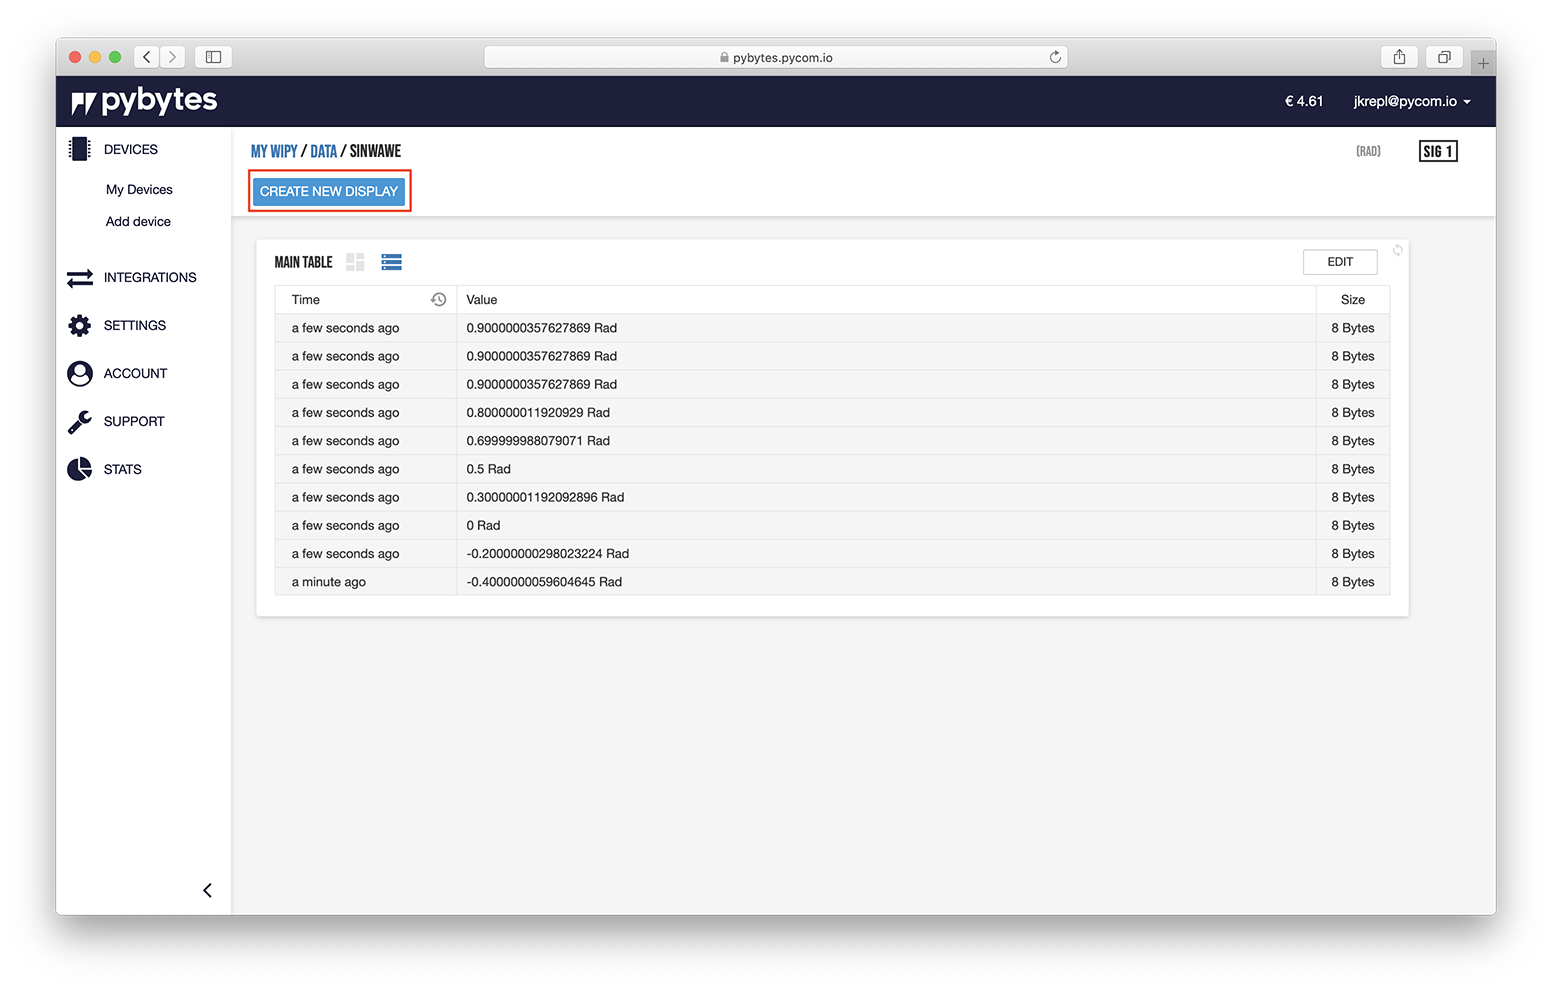
Click on the "signal card".
Click on the Create a new display button.
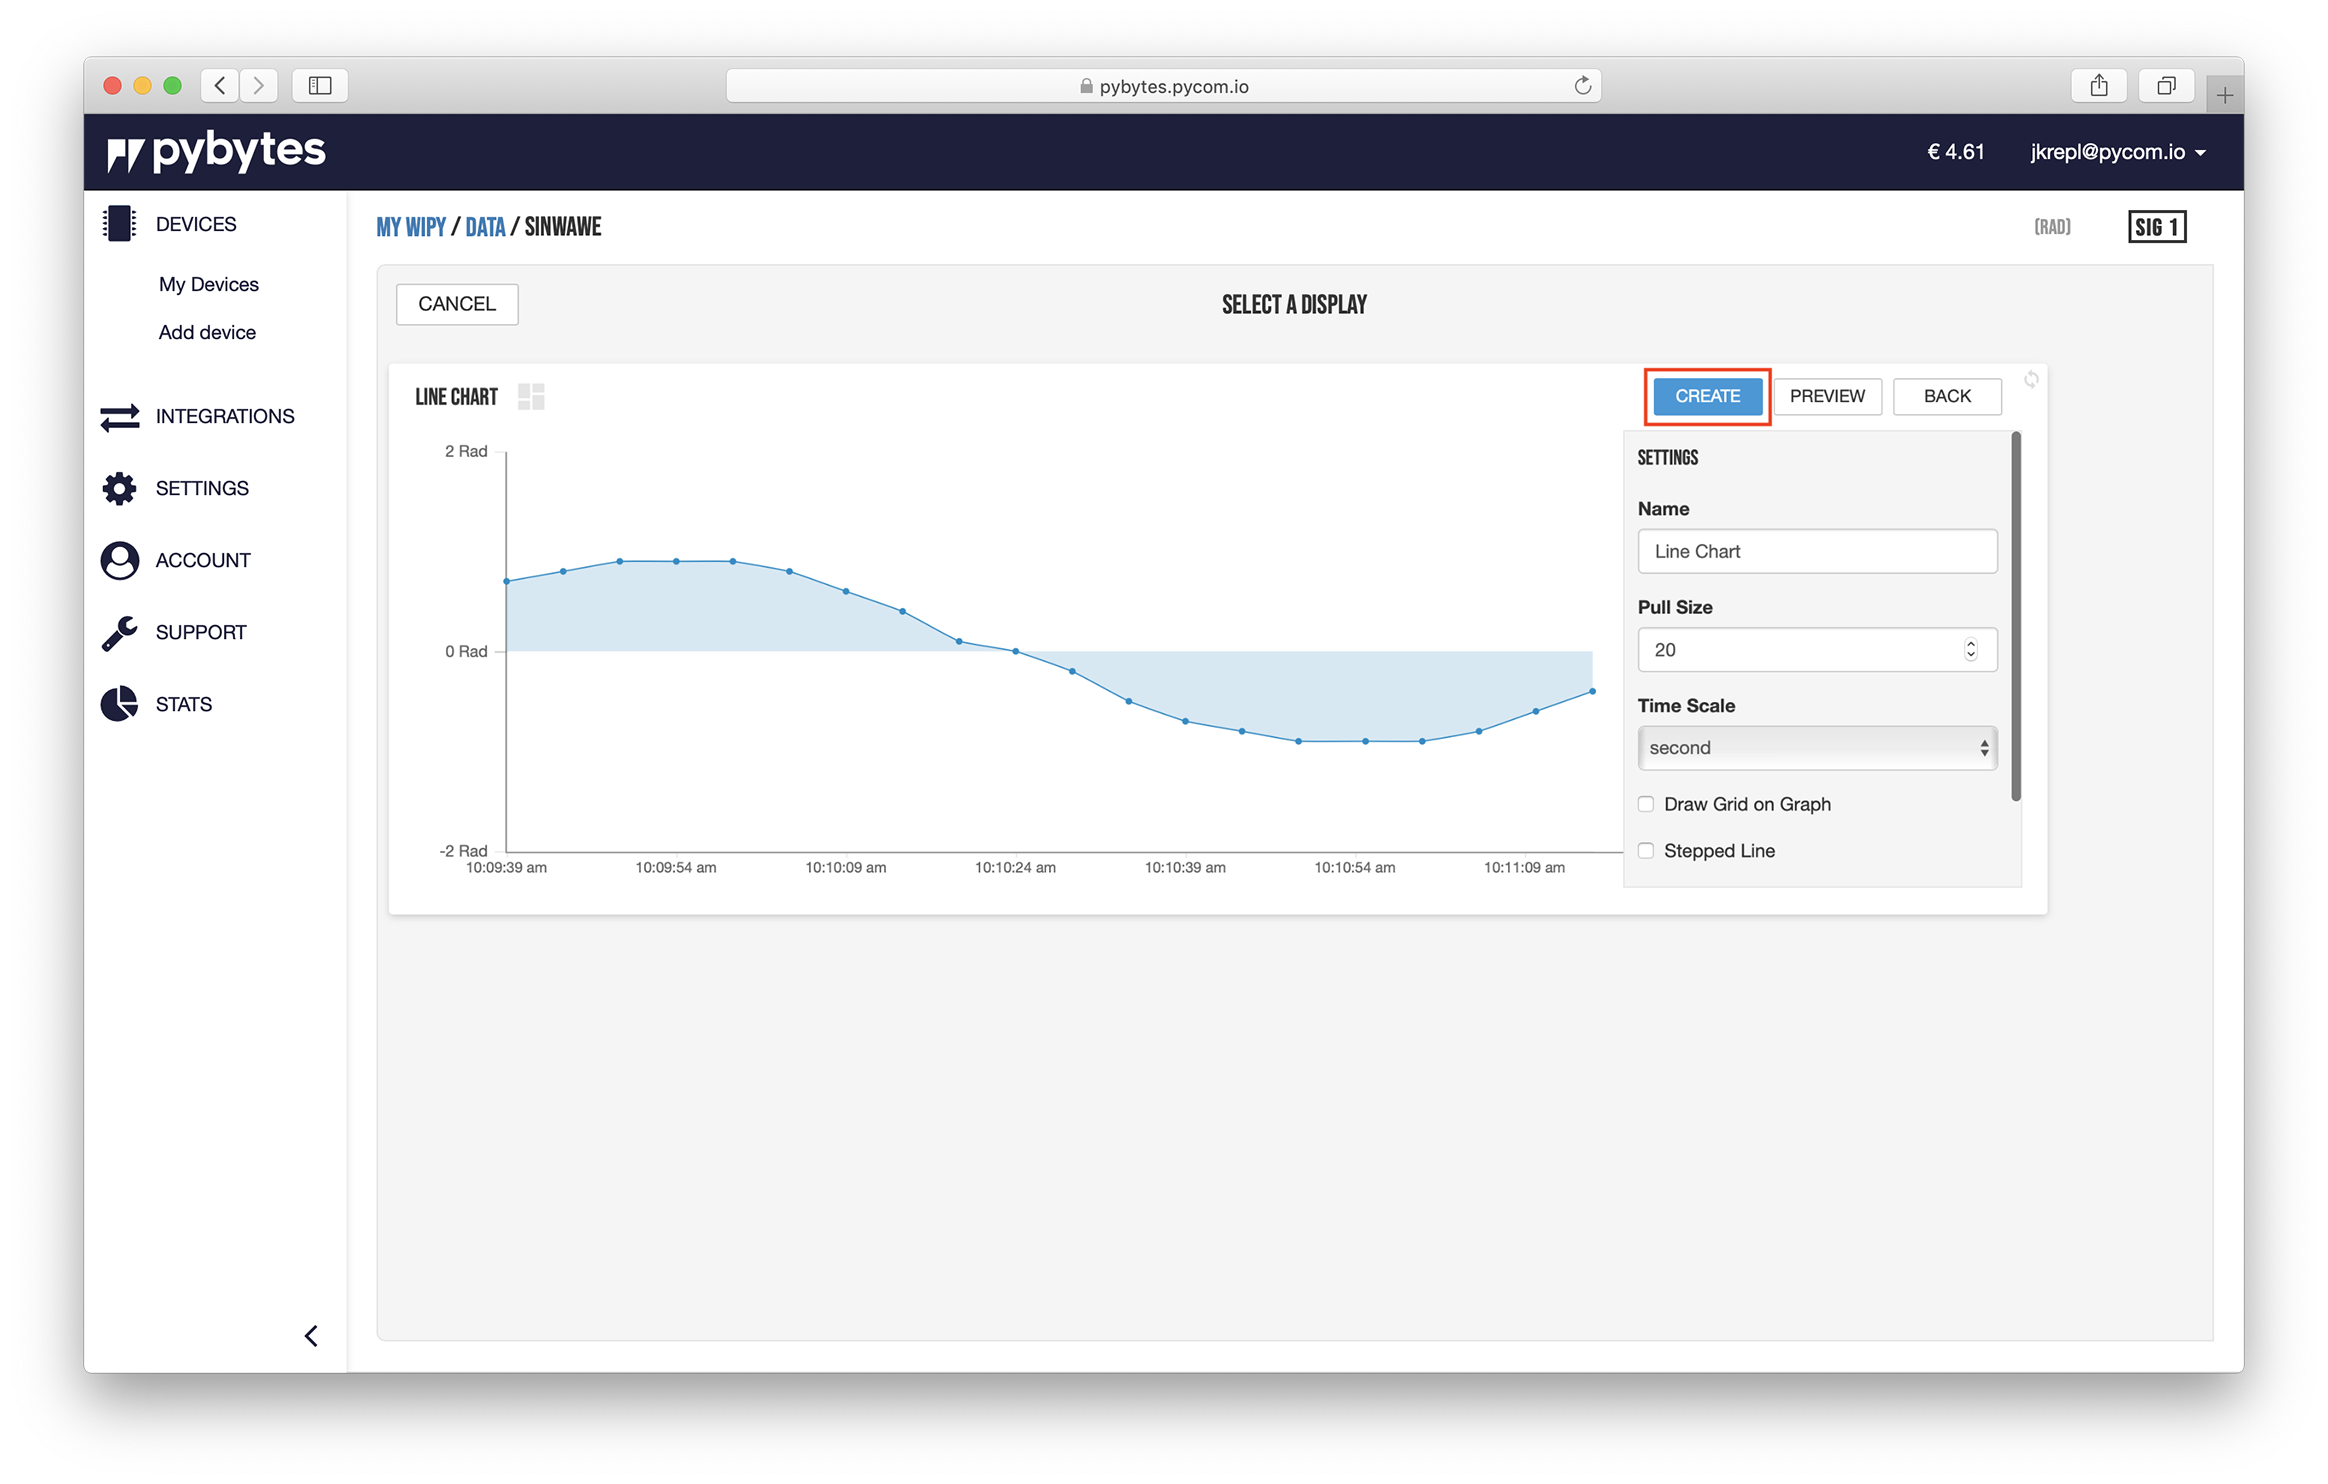
Select the type of visualisation (e.g. Bar chart or Line chart). Let's select the Line chart.
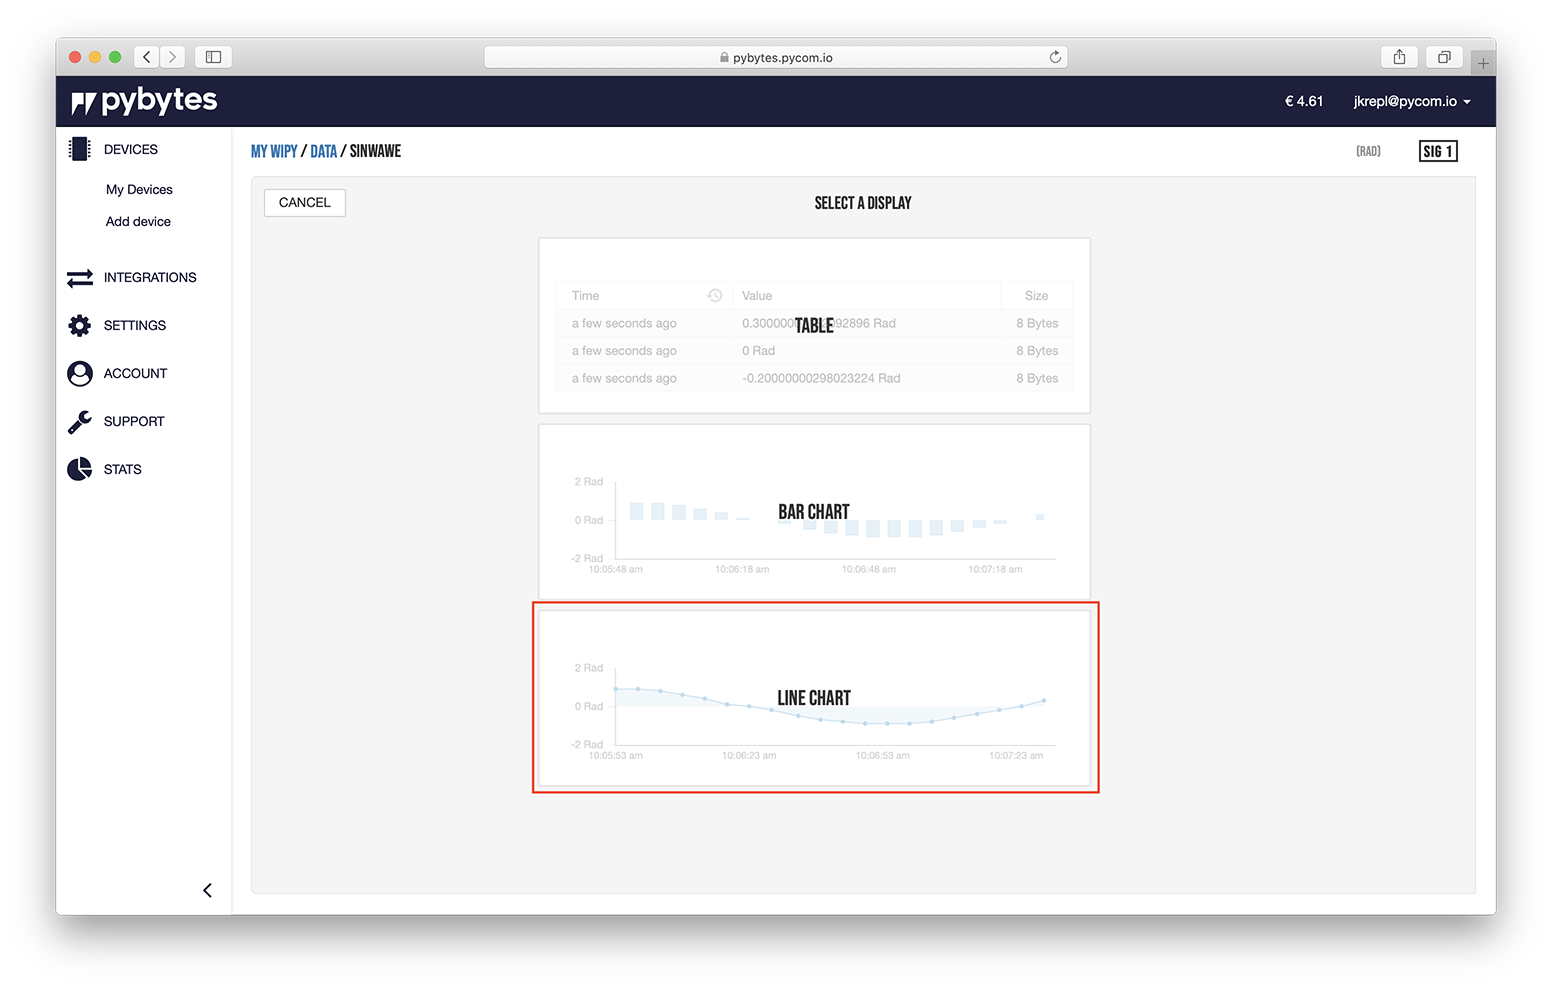
You can adjust the parameters of your widget at Settings. After, click on the button Create.
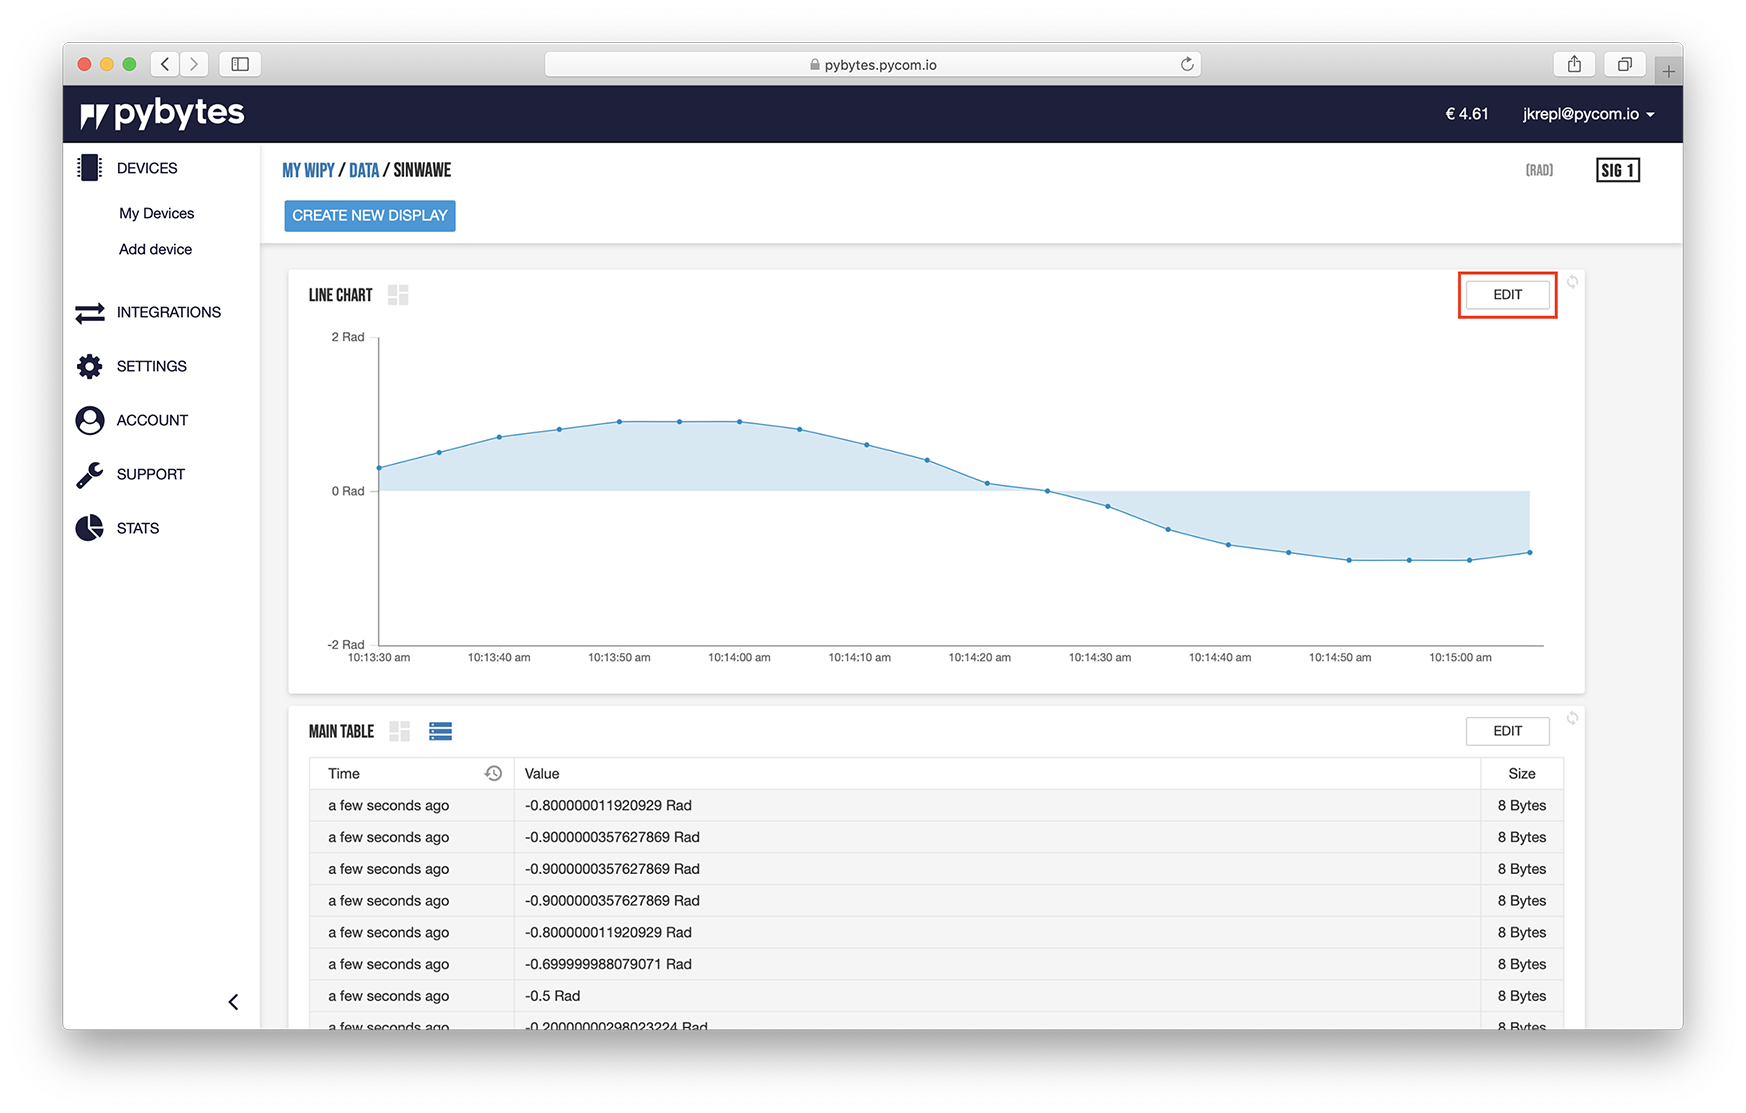
Your widget was created. Now, add your widget to your device's dashboard. Click on the button Edit on your widget.
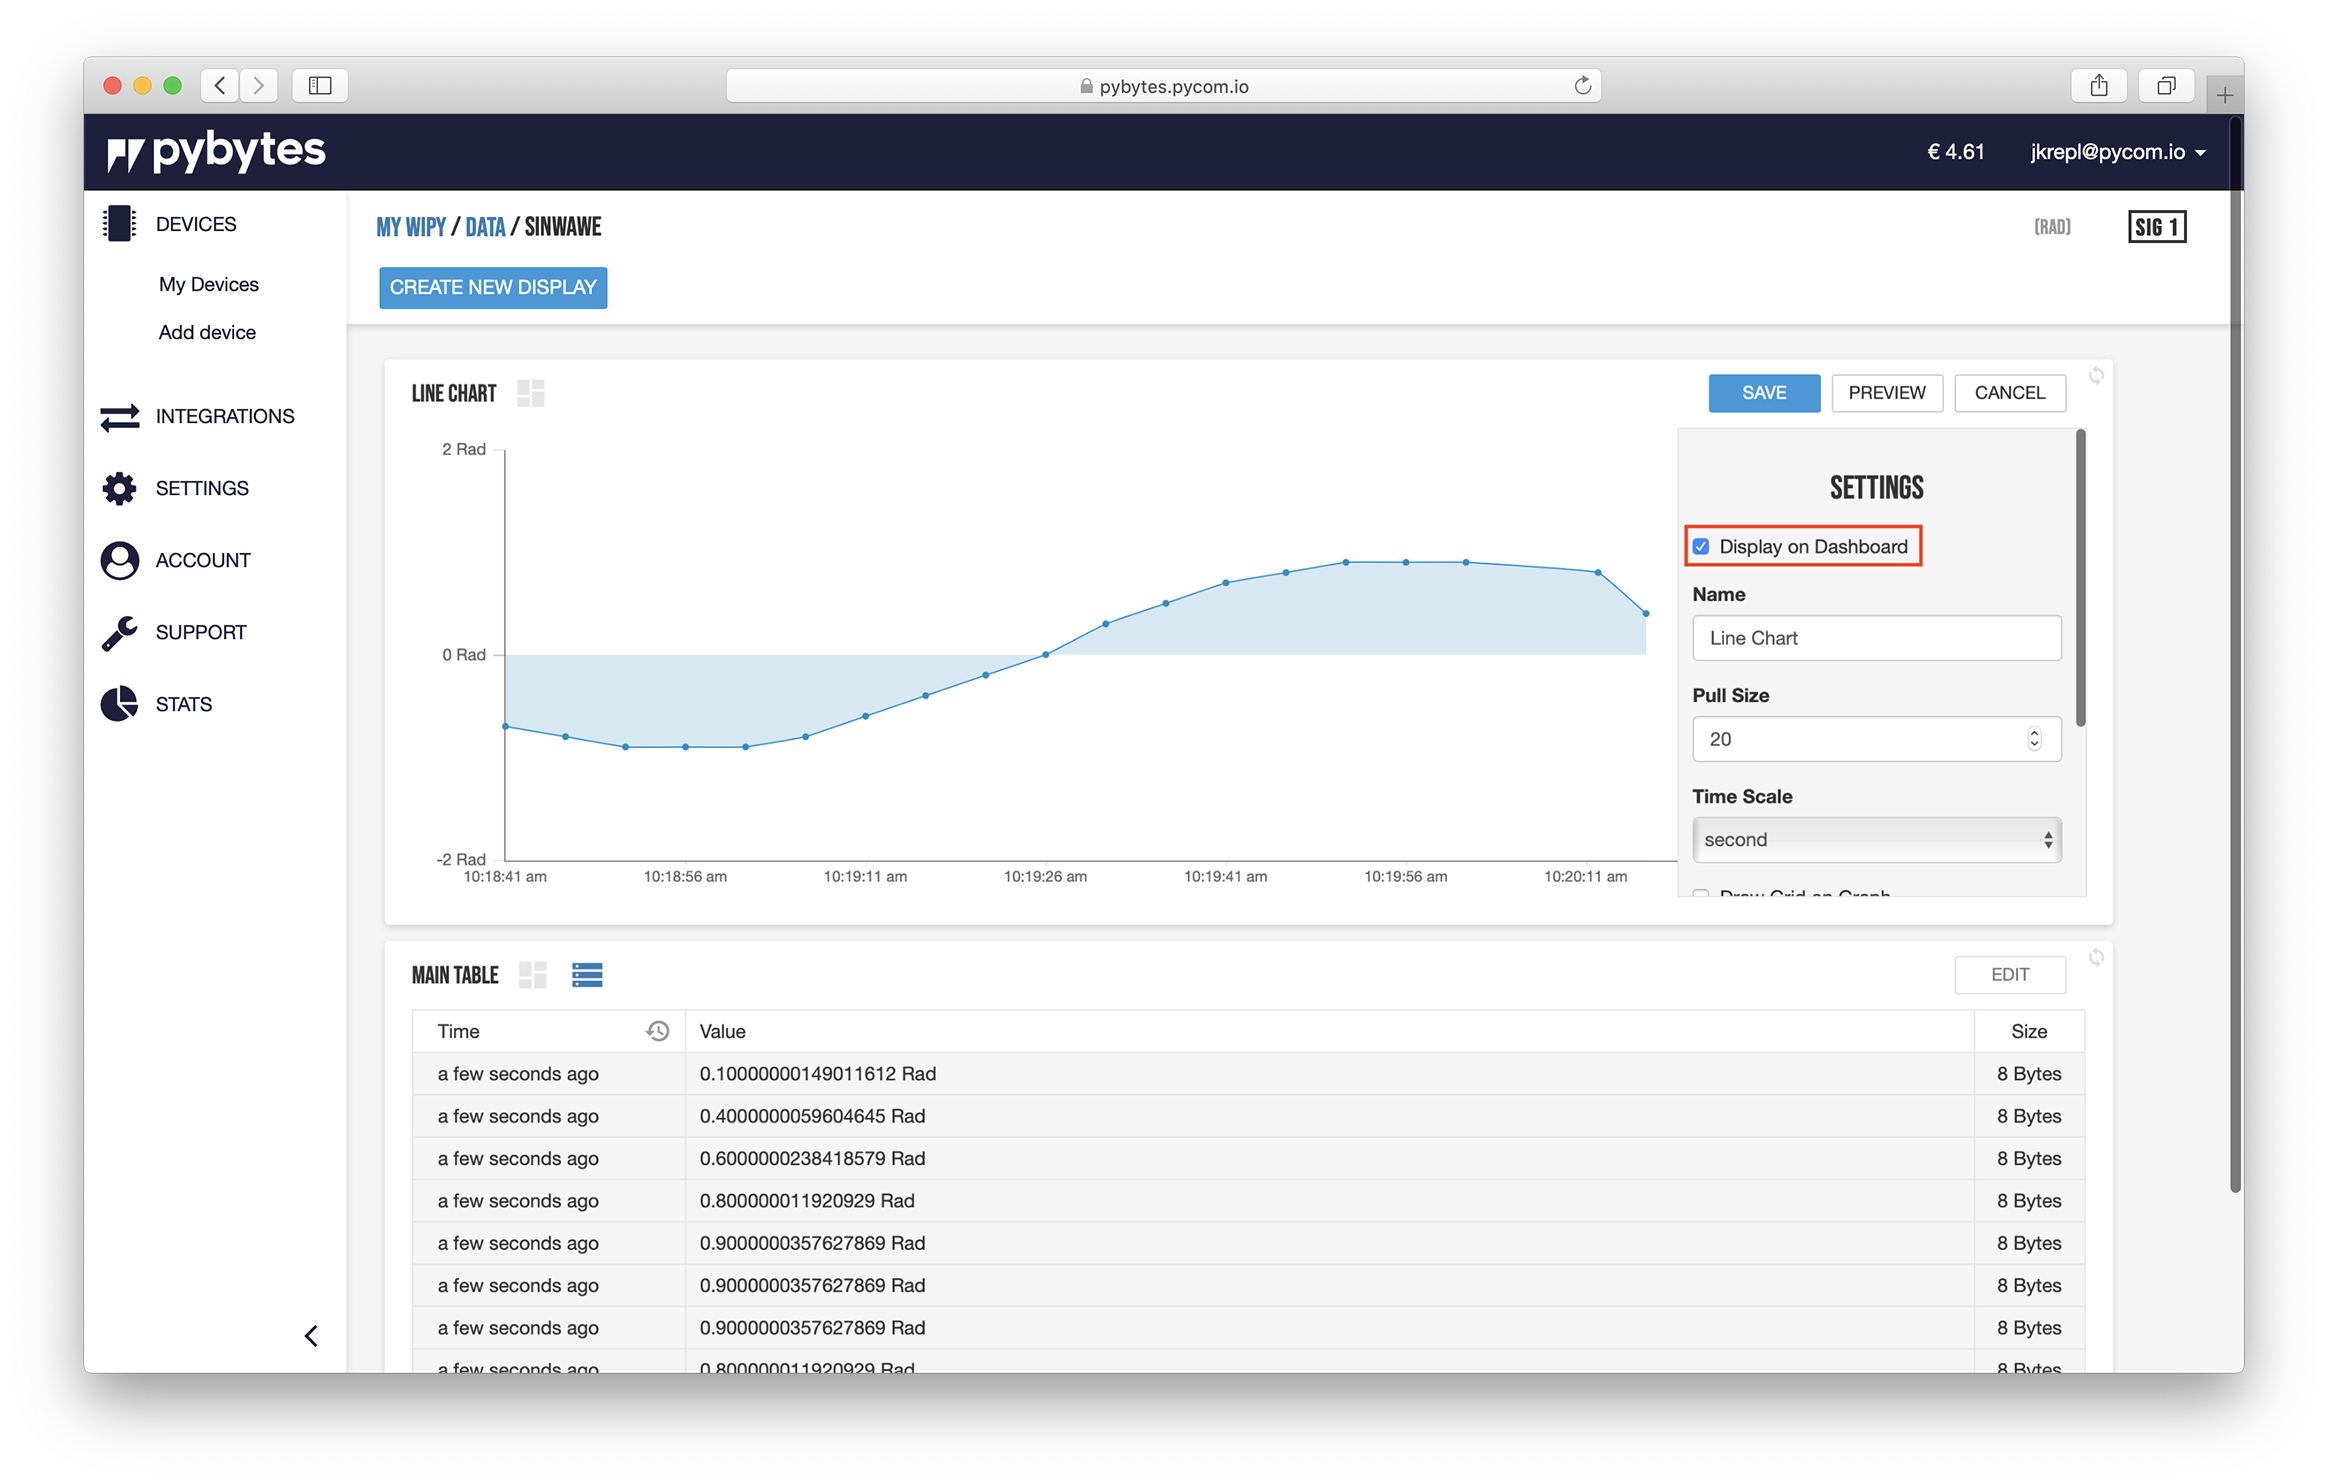
Mark the checkbox Display on Dashboard at Settings. Finally, click on the button Save.
Click on the Dashboard tab. Your widget was successfully added there!
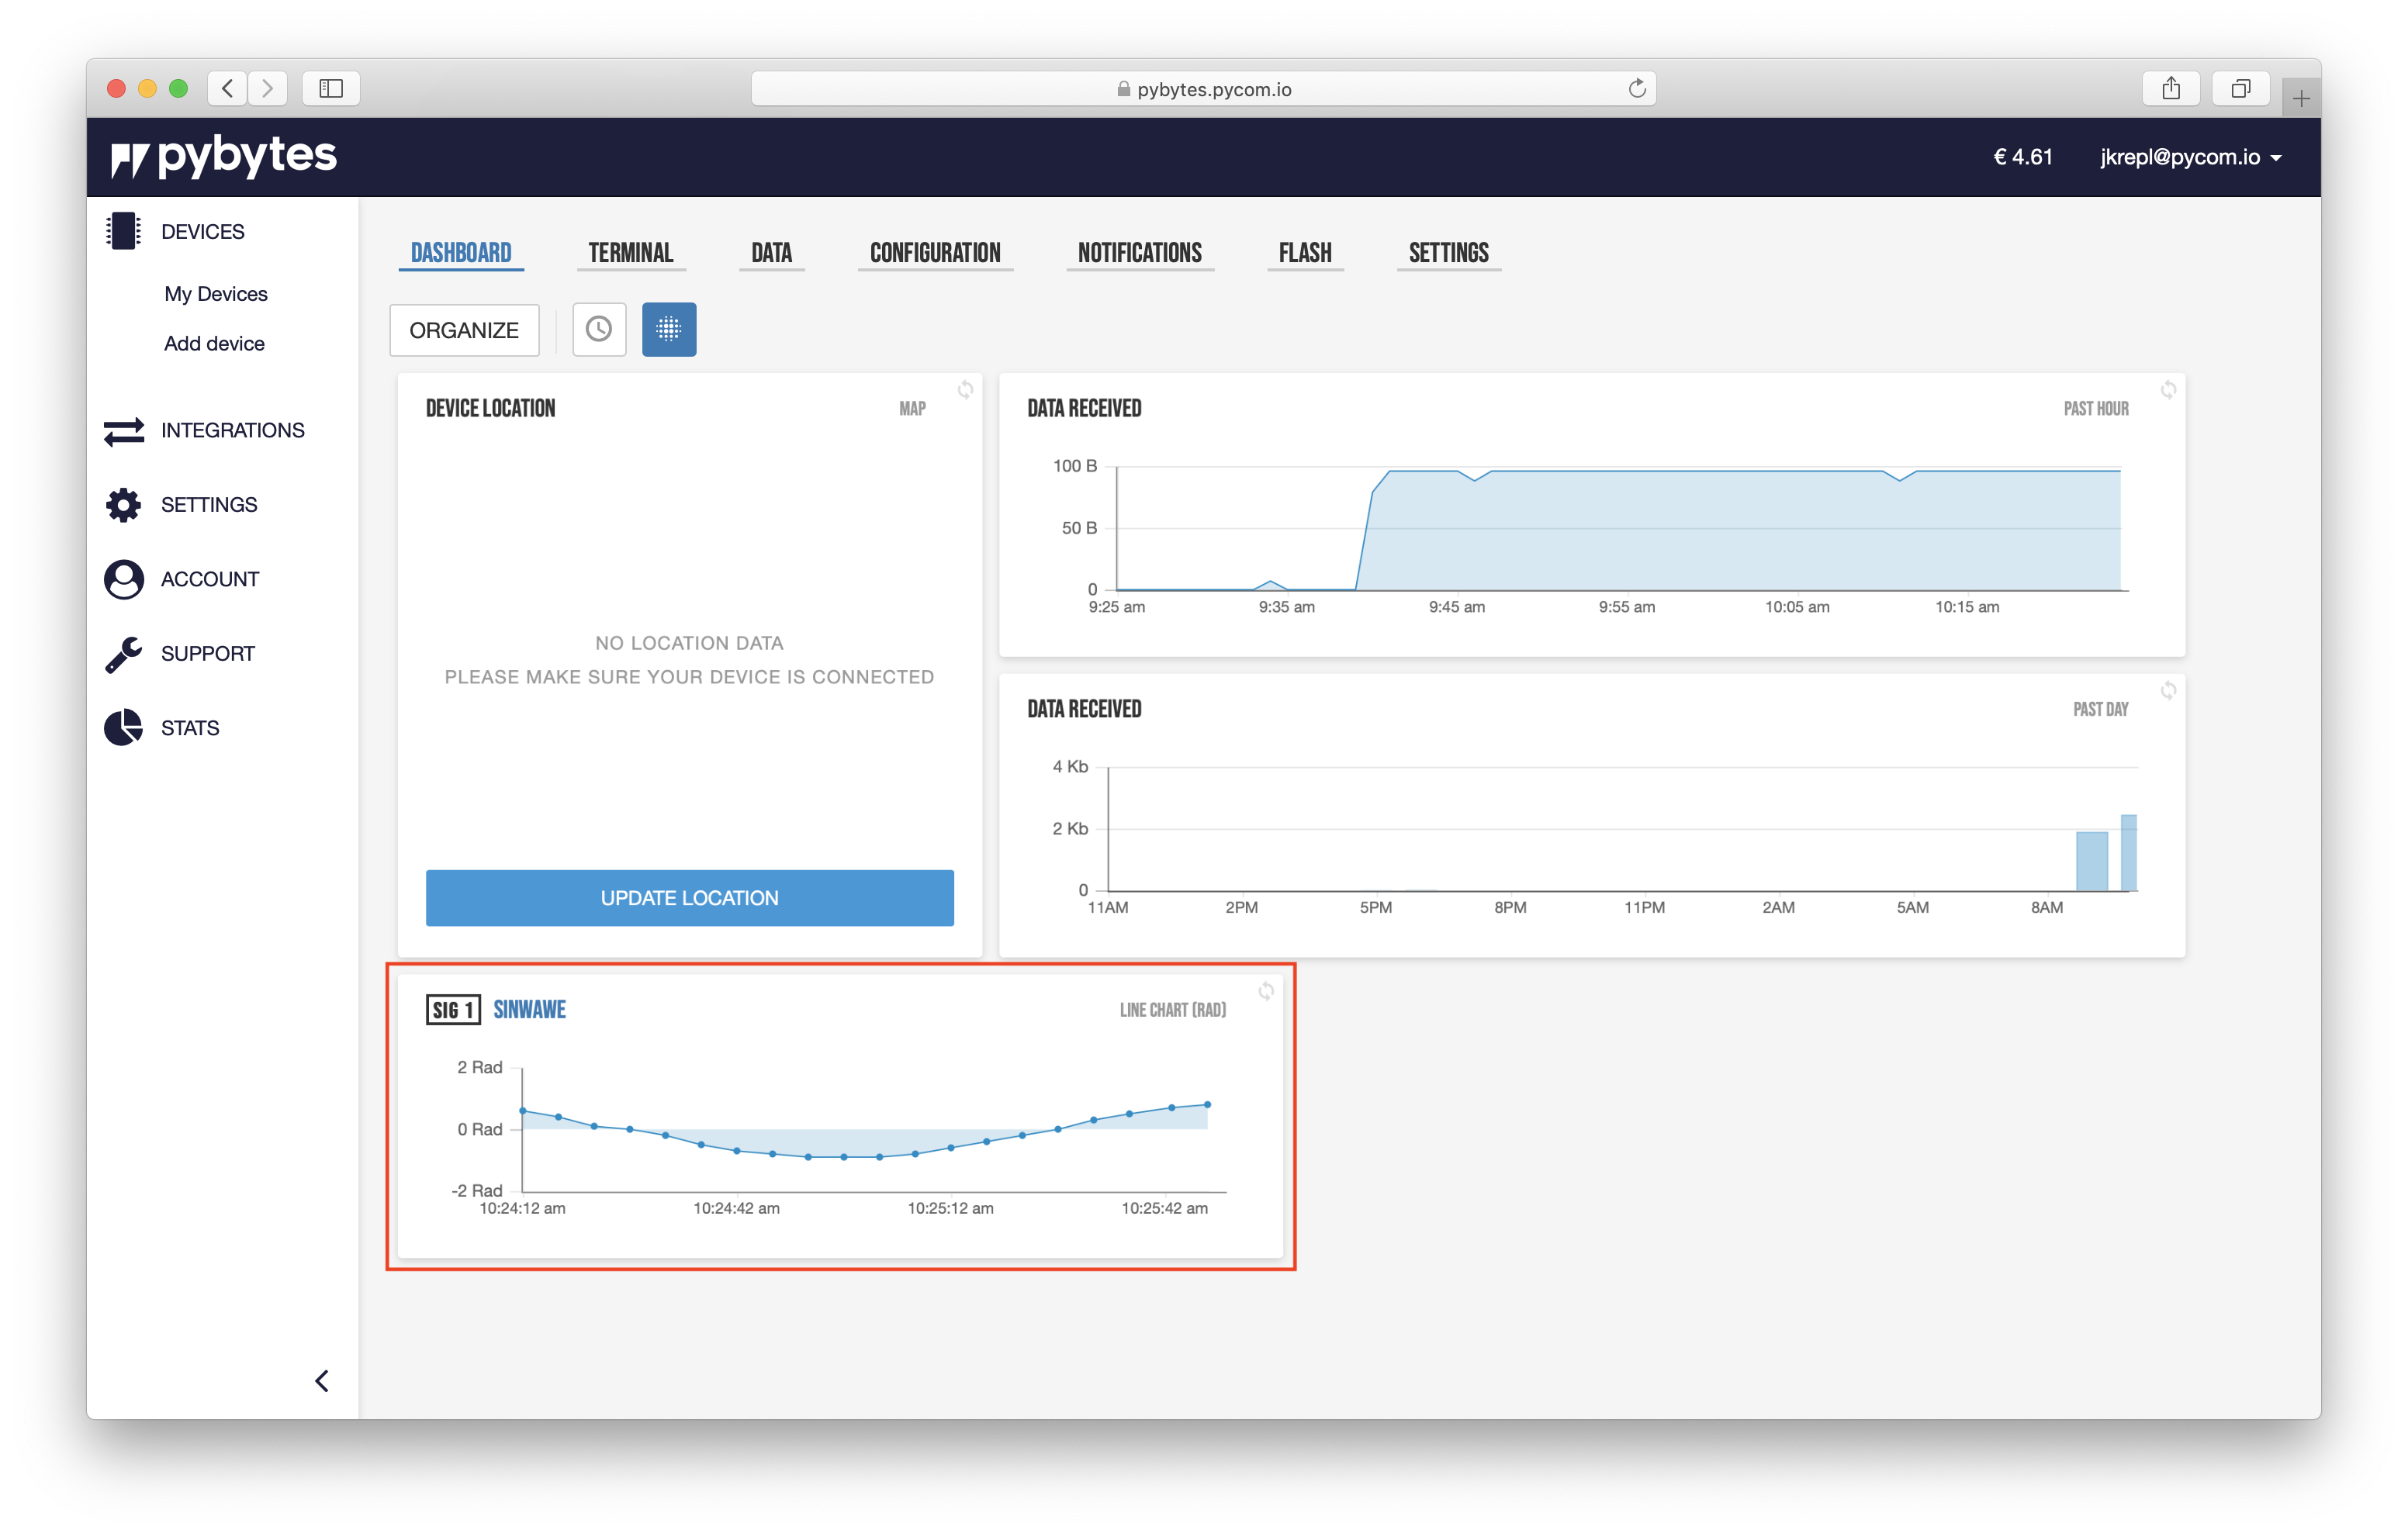
Done!
Now you've learned how to set up your device's dashboard to display data. Also, you can add more widgets to other signals of your device.